Chapter 3 The Computing Environment
The data-driven business analyst we aspire to be has to master the business analyst workflow depicted in Figure 3.1. While many books focus on the modelling component of the business analyst workflow, they do so while neglecting the context within which modelling is done. This is a fatal flaw as exclusively data-driven insight, absent of things like strategy, interpretability, or causal reasoning, is often of little use.
Figure 3.1: The business analyst transforms strategy and data into actionable insights that improve business outcomes.
To ensure our models are not isolated from having real-world impact due to poorly integrated modelling tools, we will learn an eco-system of tools that enable us to speed through the entire business analyst workflow without obstacles or impediments. While I wish I could say there was one magic bullet tool to aid us, this does not exist. What does exist, however, is a rich eco-system of tools that play fairly well with each other and can facilitate all aspects of the business analyst’s workflow, not just the modelling. At the core of this eco-system is the R programming language (R Core Team 2018R Core Team. 2018. R: A Language and Environment for Statistical Computing. Vienna, Austria: R Foundation for Statistical Computing. https://www.R-project.org/.).
In this chapter, we learn the foundational elements of this computing eco-system. Follow the below instructions to set-up your computing environment with installations of R and RStudio.
3.1 Installing R
 Figure 3.2: R logo.
R is a programming language built with statistical calculation as its primary goal. It is free and maintained/extended by an open-source community\(^{**}\). ** see https://www.fastcompany.com/3028381/how-the-rise-of-the-r-computer-language-is-bringing-open-source-to-science) We will be writing code1 This book assumes no prior programming experience. As long as you are familiar with navigating a computer, this book will point you to resources and provide resources to ease you into writing R code for business analytics. in this language to aid the transformation of data into actionable insight. Before you can use R on your computer2 Preferably, you will have access to a computer where you can install your own software and is running a Windows, (Mac) OS X, or Linux operating system. An alternative setup is to use the Posit Cloud service where you only need a browser and an internet connection. (See https://posit.cloud/.), you need to make the language accessible through your computer by installing it on your operating system. Here are the basic steps (if asked to choose a mirror - i.e. the location from which you will download your installation files - just pick a location that is somewhat close to you):
- Navigate to the
Rdownload site: https://cran.r-project.org/. - Click “Download R for
<your operating system>”. - Follow on-screen instructions. Accept all default values.
3.2 Installing RStudio Desktop
 Figure 3.3: RStudio logo.
Even though R is our programming language of choice, we will NOT rely on the supporting suite of software that accompanies the R installation to take advantage of its power. Instead, all interaction with the R language will be done using RStudio - the result of another free and open-source software project. RStudio is an integrated development environment (IDE) and designed to make a programmer’s life easier. And as business analysts who program, RStudio will be our best friend. I promise it will astound you with its ease of use and capabilities. For now, let’s just get it installed:
- Navigate to the Posit website to download RStudio desktop: https://posit.co/download/rstudio-desktop/.
- Click “Download RStudio Desktop” for your operating system (usually a blue button or link).
- Download and then run the Rstudio installation file.
3.3 Getting Help
The best thing you can do is use Google and YouTube to walk you through the installation process in more detail. Searching YouTube for “installing r and rstudio on <your operating system name>” where you replace <your operating system name> with Windows, Mac, or Linux will get you some great resources for a slower walkthrough of the process than is provided here. Also be sure to check this book’s video playlist at https://youtube.com/playlist?list=PLassxuIVwGLPy-mtohX-NXrjD8fc9FBOc.
3.4 Verify the installation
After progressing through the above install steps, check your installation is working by following these steps:
 Figure 3.4: Even though people say they are using R, most people access R through the RStudio integrated development environment. We will always use RStudio as our entry point to the R programming environment; so when accessing R using an icon, always use the icon on the right.
Open RStudio. If opening via an icon, make sure you are selecting one that looks like the icon on the right in Figure 3.4 and not like the one on the left which opens
Rdirectly (i.e. open RStudio, notR). If no icon is available, use the Windows search box or the MAC Finder sidebar and search for RStudio.Start a new
R-script by clicking the following menu options:File -> New File -> R Script. You should now see four panels as shown in Figure 3.5.
Figure 3.5: The RStudio user interface.
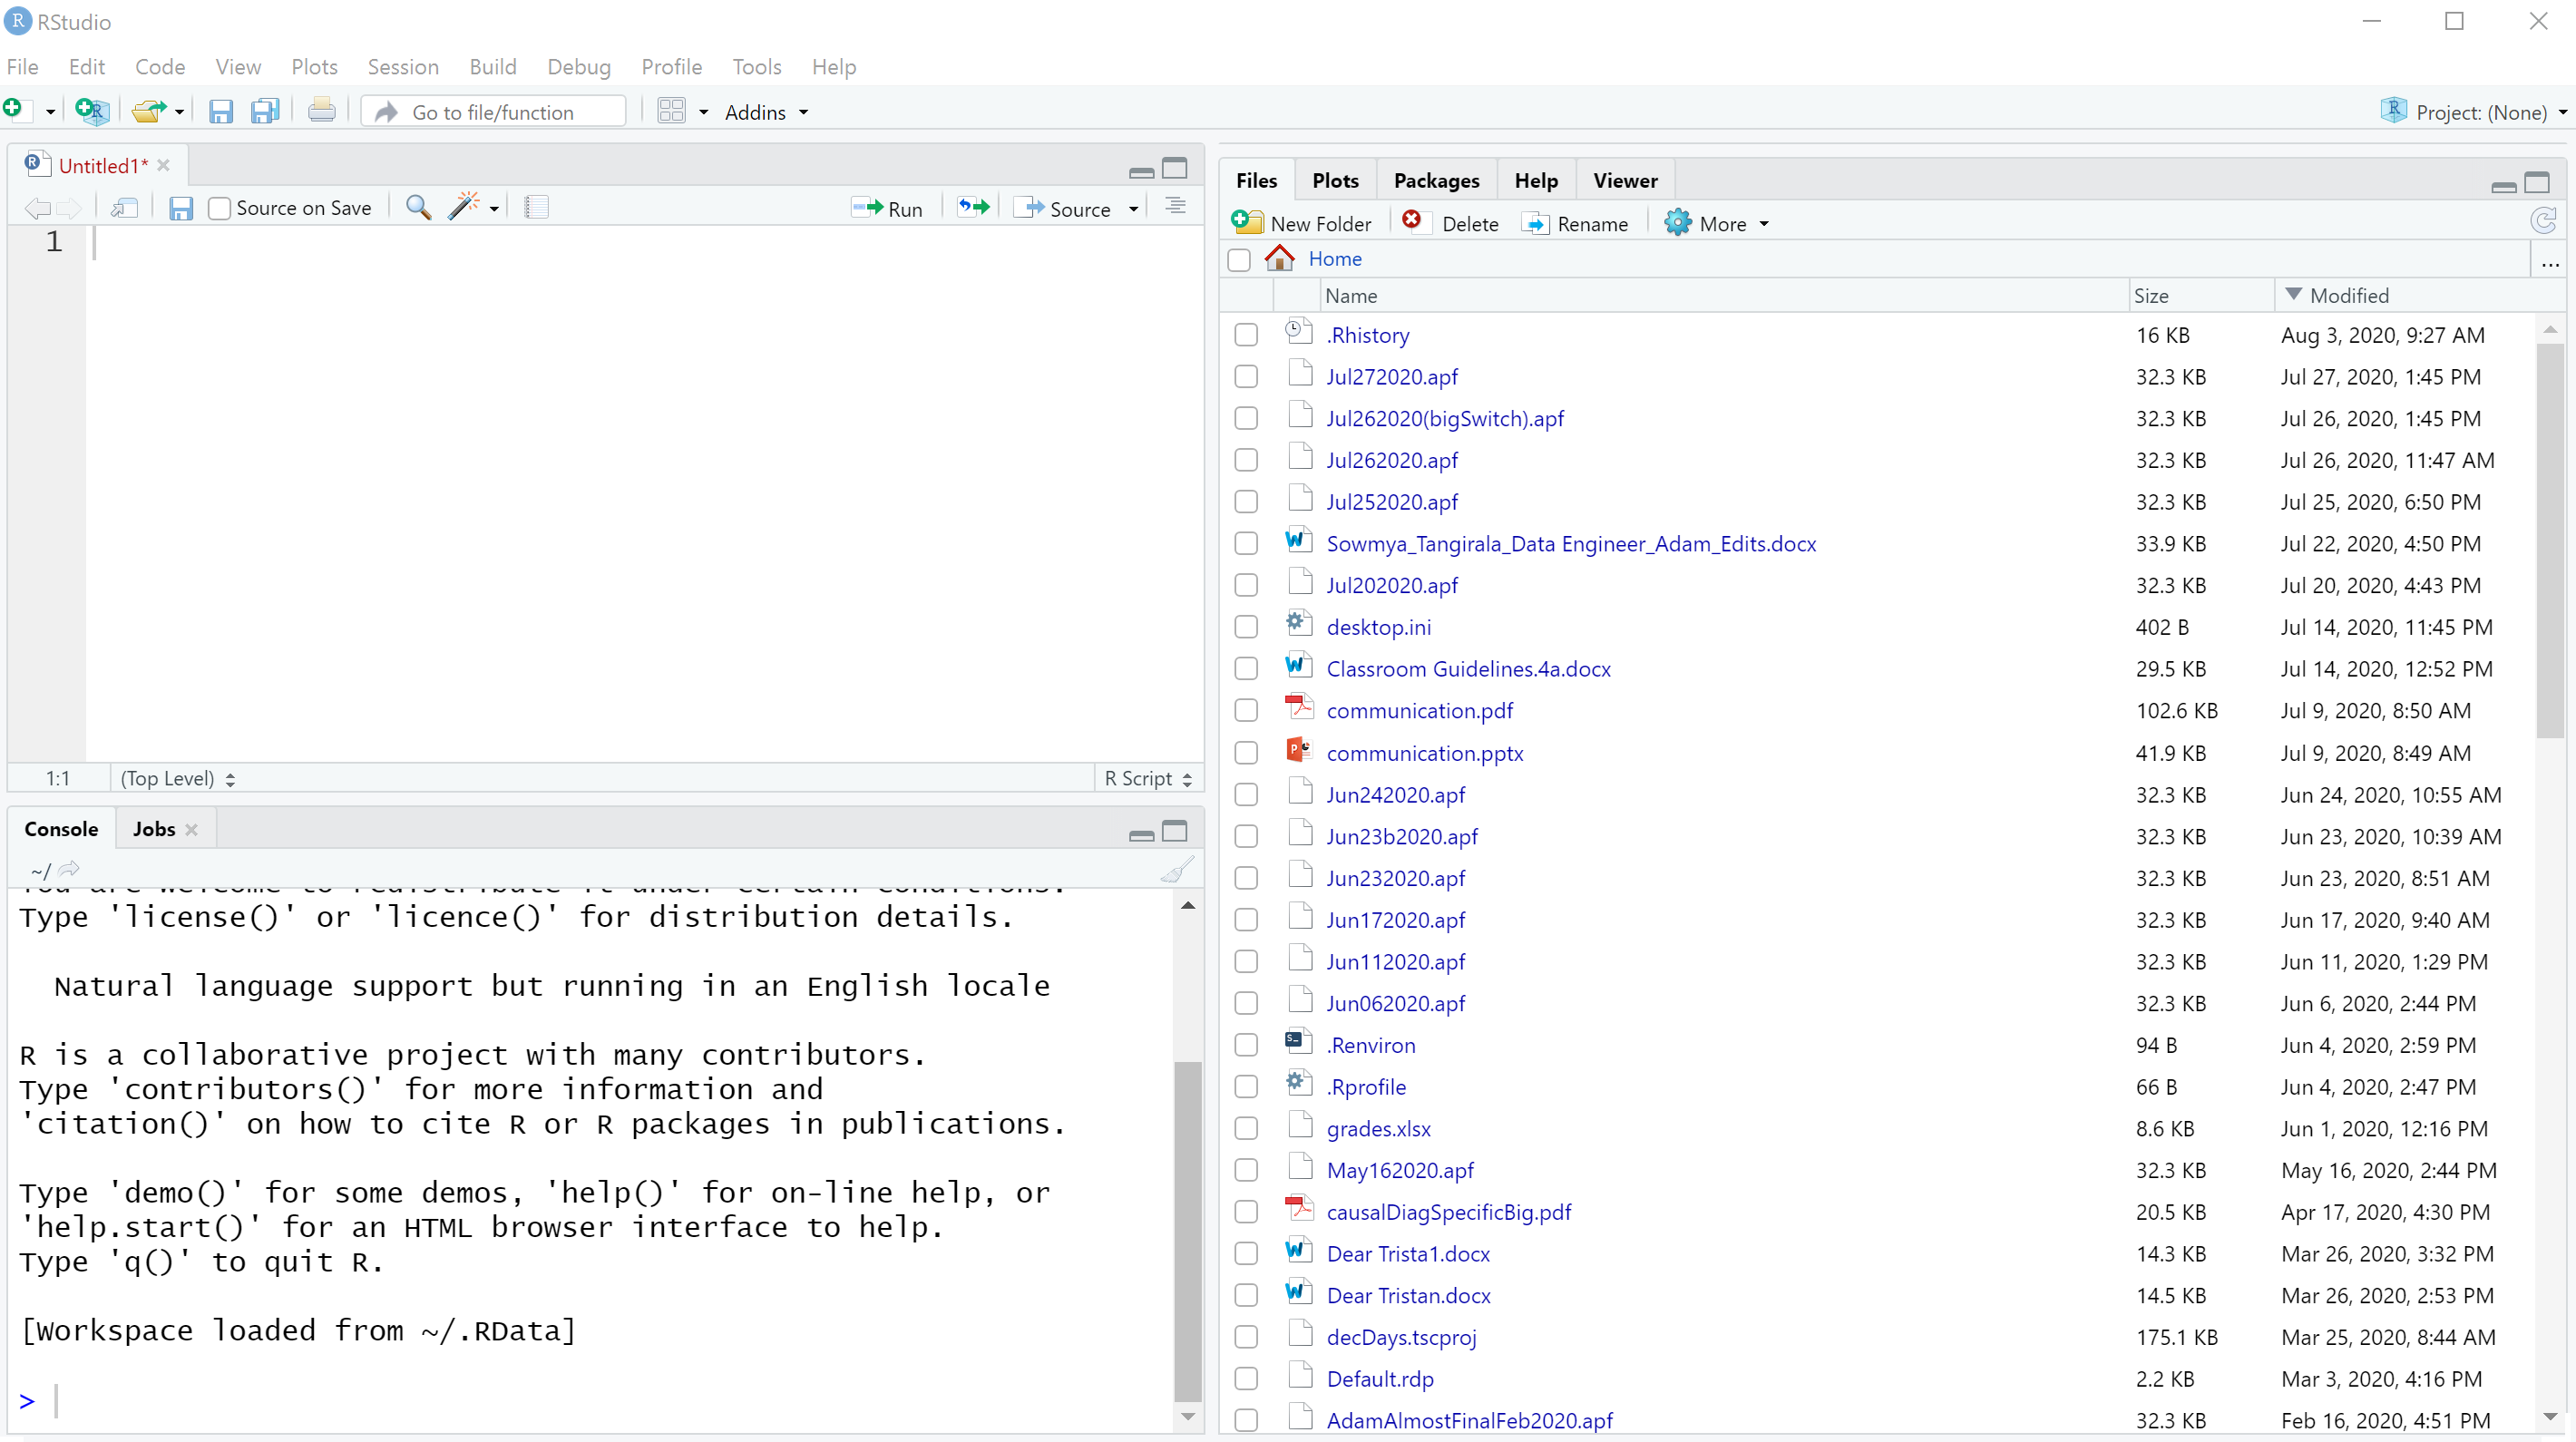
The bottom-left panel is known as the
Consolewindow and you will use this window to execute commands that will not be part of your final data analysis program. To test this window, type 2 + 2<ENTER>as shown below:## [1] 4If your
Consolewindow looks similar to the above and you see the resulting answer of4, then yourRand RStudio installations have been successful.3 There may be slightly more printed on the screen than simply the answer of 4. The##precedes output resulting from an executed command and the[1]signals that the first element of the output is being shown.
3.5 Install and verify R-packages
R’s strength as an analytics environment is largely due to its extendability through packages. A package is simply a container used to distribute code and data - like specialized statistical techniques, cool graphical capabilities, simplified reporting capabilities, interesting datasets, etc.
We will install the following packages into our R-environment:
- ggplot2
ggplot2is an enhanced data visualization package forR. - dplyr
dplyrmakes manipulating data intuitive and fast. - tidyr
tidyrputs data into a clean format for munging (withdplyr), visualization (withggplot2) and modeling (withR’s hundreds of modelling packages). - lubridate
lubridateis anRpackage that makes it easier to work with dates and times. - stringr The
stringrpackage aims to provide a clean, modern interface to common string operations.
A string, also called a character string, is one or more characters enclosed in a pair of quotes. Strings represent text inside the computing environment.
To install these packages, navigate to the Packages tab in the lower right panel of RStudio:
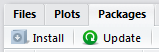
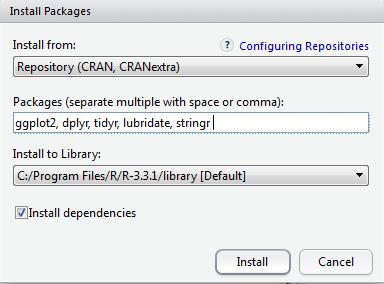
and press the Install button. In the dialog box that opens, enter the package names (case-sensitive), separated by commas, as shown in Figure 3.6. Press Install.
Figure 3.6: Installing packages via RStudio’s user interface.
Your system will now download the computer code for those packages. This process may take several minutes. After completion, verify that all packages are installed. As an example, we will verify that the ggplot2 package installed properly: Most of the time you will see R-users use the install.packages() function instead of using the Install button of the user interface. We show the install button here to keep things simple for now.
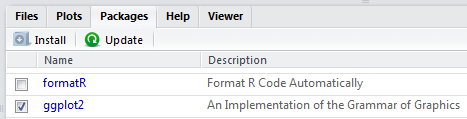
Ensure that the
ggplot2package is visible in thePackagestab as shown in Figure 3.7. It will be unchecked.Click the checkbox for the
ggplot2package as shown in Figure 3.7. Ensure that the checkbox remains checked. Even though the package is on your computer, this makes the package available for use in your currentR-session (this is equivalent to running the commandlibrary(ggplot2).Figure 3.7: Making the ggplot2 package available in your current R session.
The below code uses the qplot function from the ggplot2 package to produce a plot:
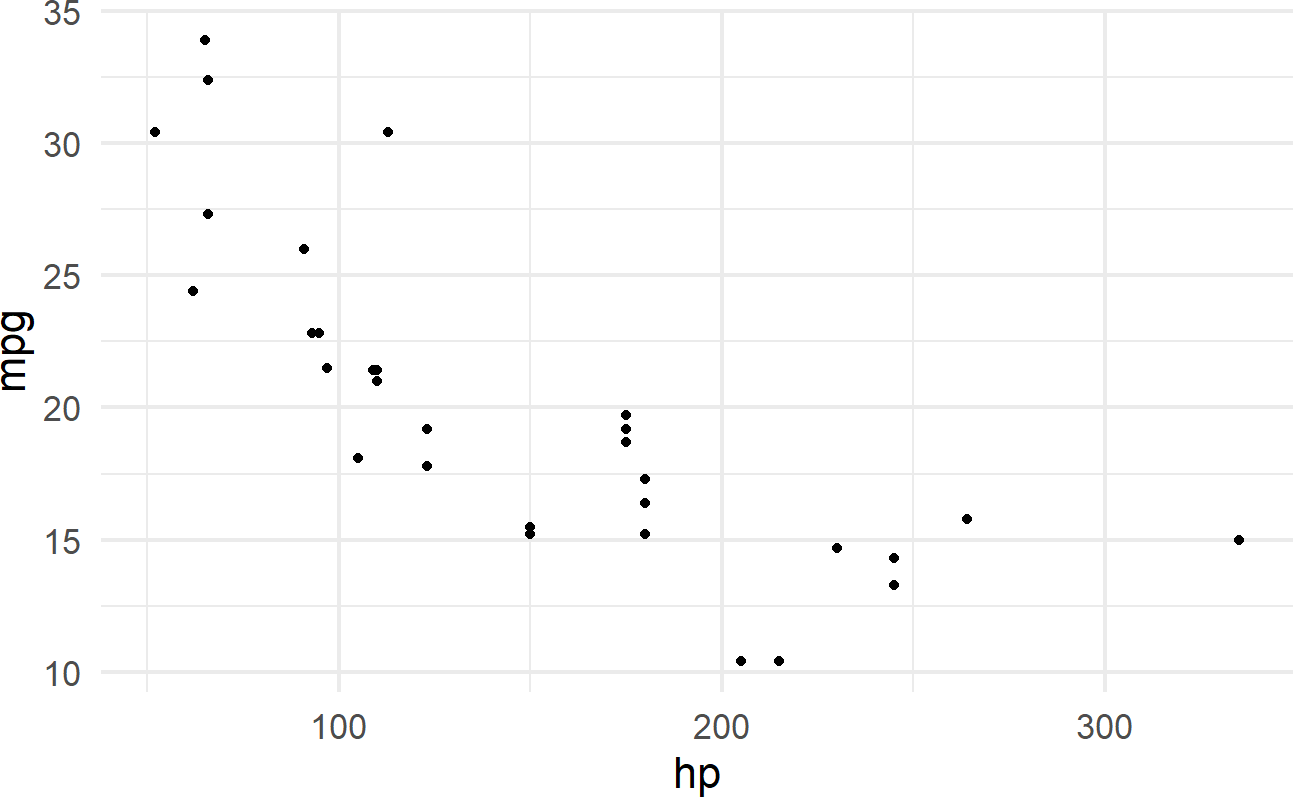 Figure 3.8: Higher horsepower leads to less fuel efficiency among cars featured in the 1974 Motor Trend magazine.
Type the above two lines of code (excluding the > or + and using a capital ‘S’ for Species) into your console window and press <ENTER> after entering each line. You should have a nice plot appear (similar to the plot in Figure 3.8). It shows data from 32 automobiles featured in the 1974 Motor Trend U.S. magazine.
Congratulations!!! Your computer is now ready to start your journey. To supplement this text, it is recommended you familiarize yourself with R using the short tutorial available here: https://cran.r-project.org/doc/contrib/Torfs+Brauer-Short-R-Intro.pdf (skip the installation instructions since you did that already).
3.6 Recommended Customizations
In order to get the most out of RStudio, a few customization options are helpful. Within RStudio, navigate and click on Tools -> Global Options (see Figure 3.9). A dialog box will open whose left-side has categories of options (e.g. General, Code, Appearance, etc.). Navigate through the left-side categories specified below and ensure the following option selections:
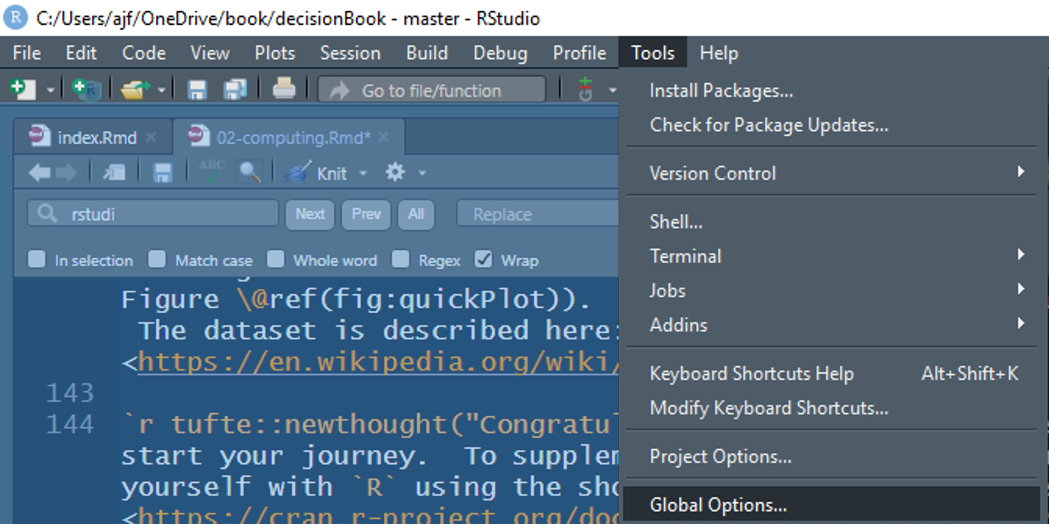 Figure 3.9: Finding the global options screen.
- General: Uncheck
Restore.RData into workspace at startup. - General: Select
Neverfor theSave workspace to .RData on exit. - Code: Check
Soft-wrap R source files(in theEditingtab). - Code: Check
Use tab for multiline autocompletions(in theCompletiontab). - Appearance: Feel free to experiment with choosing options that personalize the look of your RStudio for you. I like the following:
- RStudio Theme:
Modern - Zoom:
100% - Editor Font:
Lucida Console - Editor Font Size:
13 - Editor theme:
Cobalt
- RStudio Theme:
While you might not understand all of the above at this point in your journey, the above customizations will provide an easier-to-use experience with RStudio than just leaving all the default values.