Chapter 25 Your Journey Continues
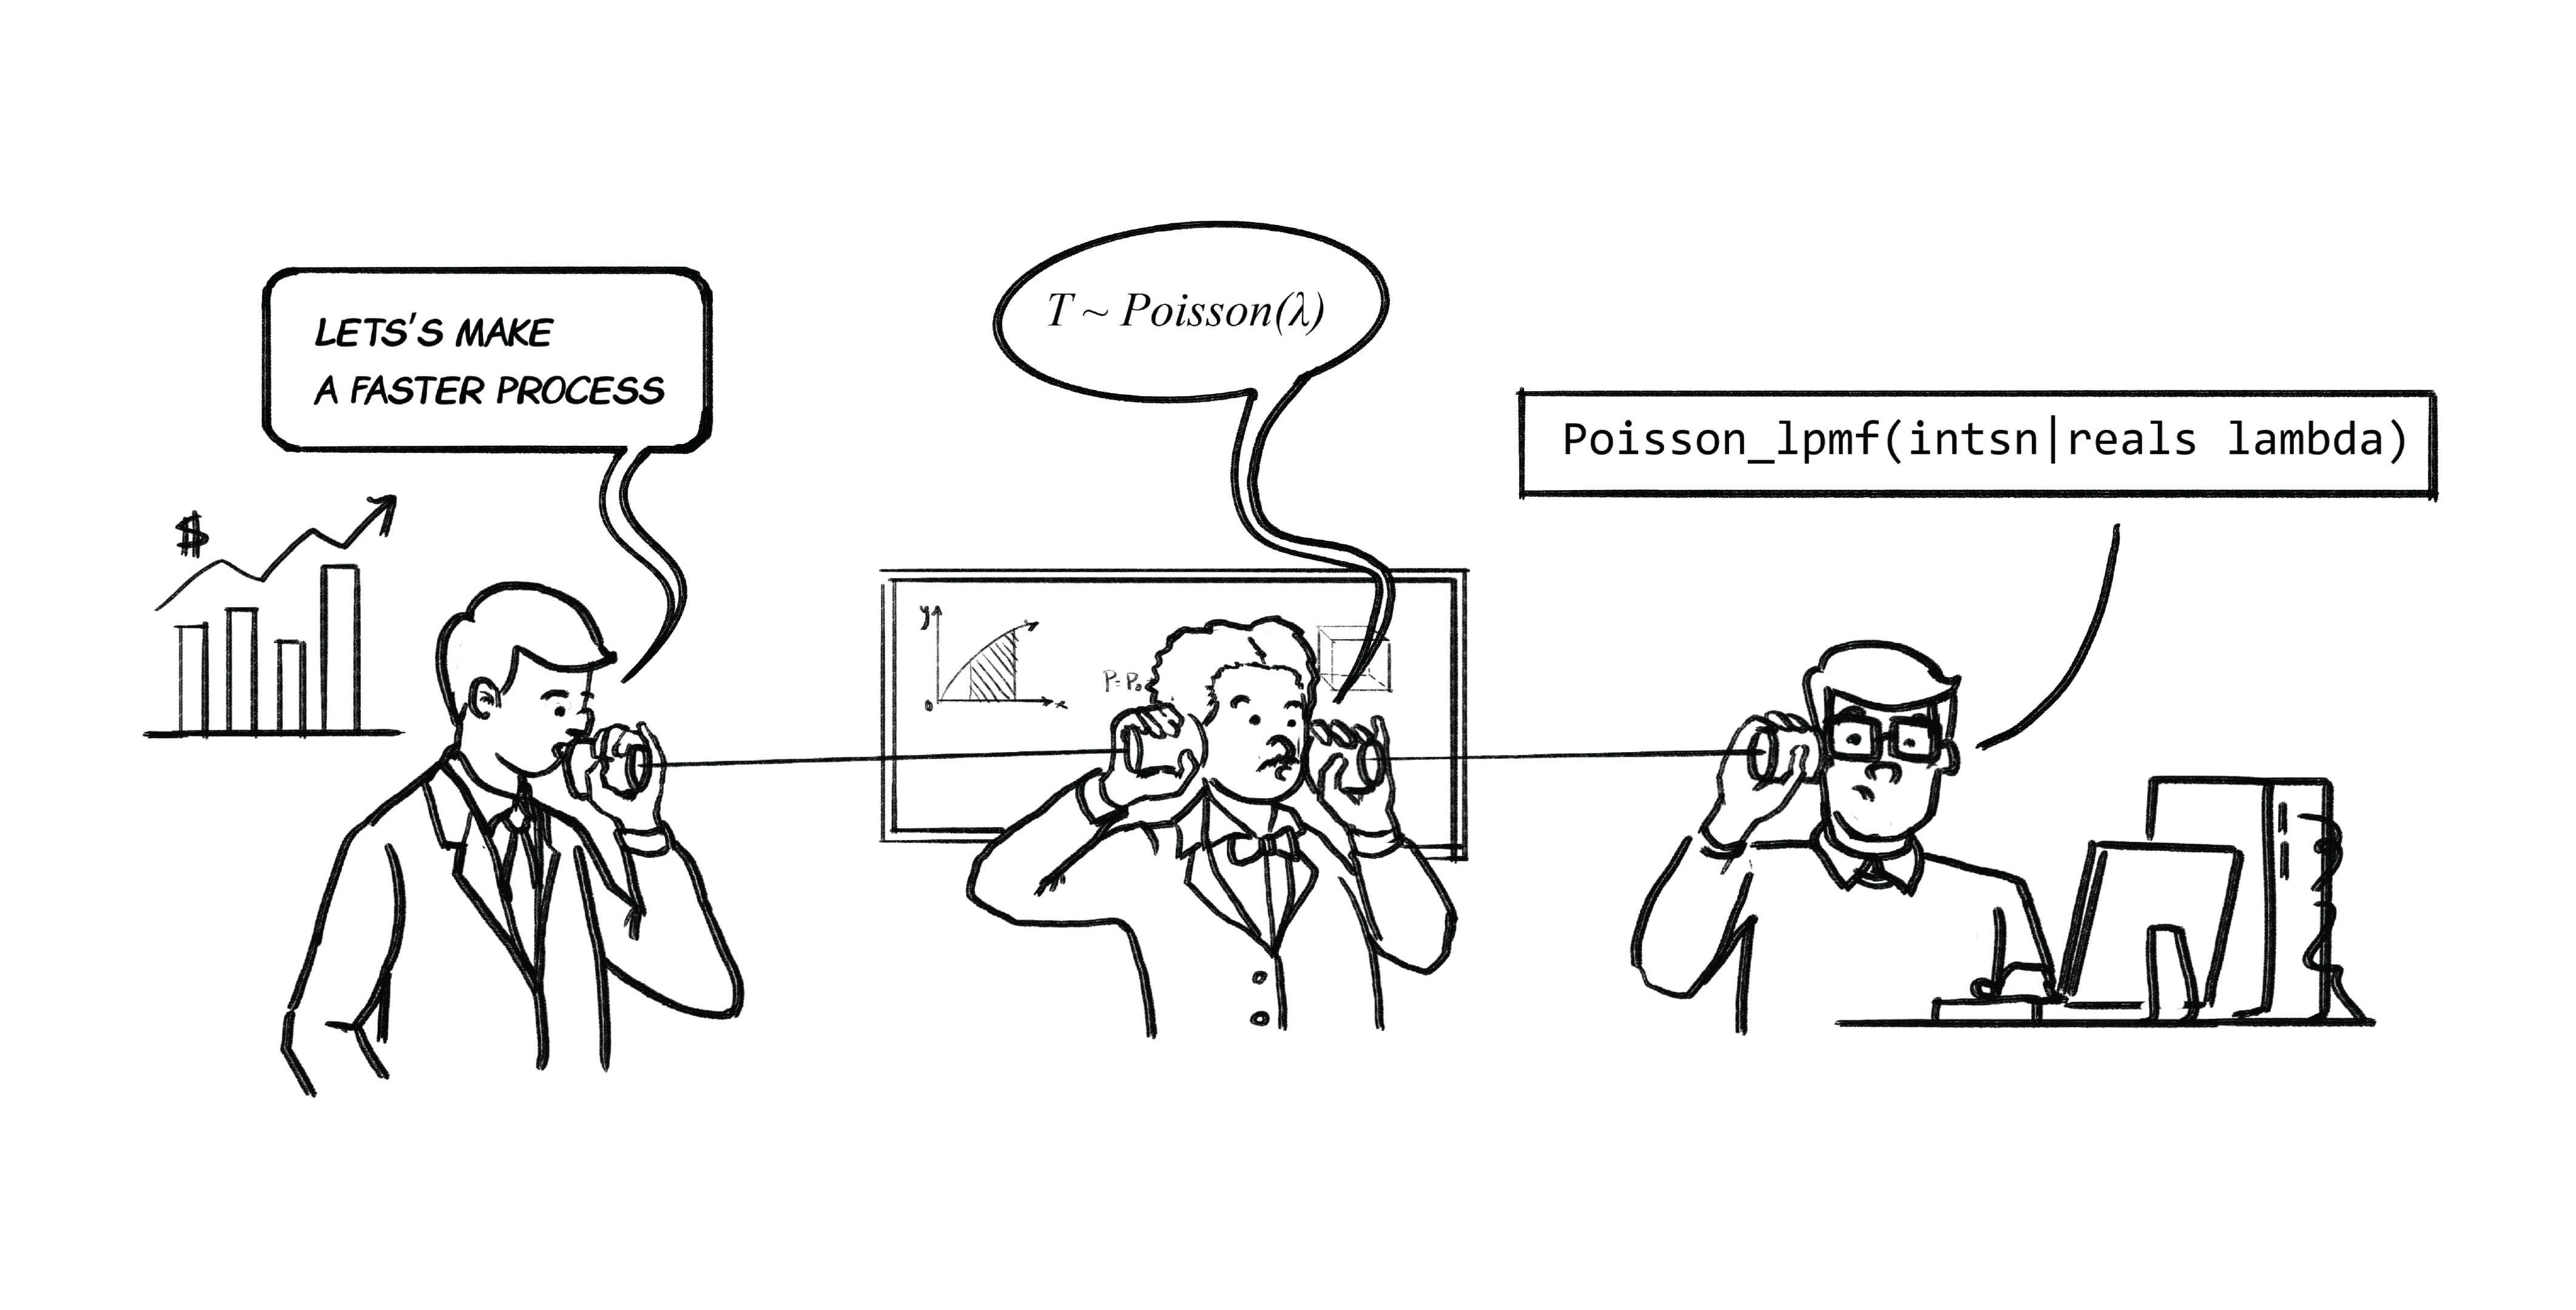
Figure 25.1: Translating a CEO’s concerns into math and computer representations is challenging.
CONGRATULATIONS!!! You have journeyed through a challenging path and persevered. You are now equipped to “release the BAW”. In your journey, you learned to coordinate three languages – 1) graphical models to aid business communication , 2) probability theory for Bayesian inference, and 3) the R programming language to manipulate and visualize data as well as to give you access to statistical computation. Your language coordination abilities help you overcome the challenges faced by the poor people depicted in Figure 25.1. The use of generative DAGs from the causact package enabled you to reduce the friction between these languages. As a tradeoff, however, your knowledge in any one of the languages only runs so deep. Now is the time to keep going and pick from the below resources to further develop your skills.
25.1 Additional Reading
- Michael Betancourt (2018Michael Betancourt. 2018. Towards a Principled Bayesian Workflow (RStan). https://betanalpha.github.io/assets/case_studies/principled_bayesian_workflow.html.) provides the scientific philosophy of Bayesian statistics and associated computational methods with mathematical rigor and beautiful pictures.
- Gelman, Hill, and Vehtari (2020Gelman, Andrew, Jennifer Hill, and Aki Vehtari. 2020. Regression and Other Stories. Cambridge University Press.) dives much deeper into multilevel regression than is done in this text. These three authors are gurus of applied Bayesian statistics.
- Grolemund and Wickham (2018Grolemund, Garrett, and Hadley Wickham. 2018. “R for Data Science.”) is a fundamental read on R programming, data manipulation, and using R in analytics workflows.
- McElreath (2020McElreath, Richard. 2020. Statistical Rethinking: A Bayesian Course with Examples in r and Stan. CRC press.) made a pedagogical masterpiece that teaches more mathematically rigorous Bayesian statistics in a fun way. I highly recommend this as the next book in your journey.
- Wilke (2019Wilke, Claus O. 2019. Fundamentals of Data Visualization: A Primer on Making Informative and Compelling Figures. O’Reilly Media.) is a wonderful read for exploring data visualization. All the code for numerous beautiful
ggplotsis made available to the reader.
25.2 Goodbye for Now
That’s all I have; thanks for making it through the text. Reach out to me on Twitter (@preposterior) if you are liking the book or have suggestions. I am sure there is boundless room for improvement. Keep going, enjoy the journey, and embrace the productive struggle of a world-class business analyst!